Timekeeping statistics
Goodtime offers comprehensive analyses and statistics on working hours and project time.
The different views of the statistics
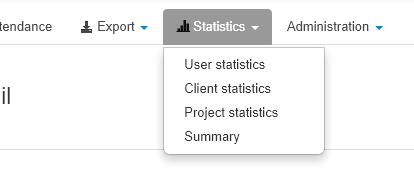 Depending on the permissions of the user and the individual
settings
of your timekeeping system various sub-tabs are displayed under the tab 'Statistics'.
The statistics for the selected scope are displayed in this sub-registers
- e.g. statistics for projects or clients. Unprivileged users can only view statistics of their own working hours.
Manager roles have access to the statistics of the respective area.
Thus a staff member with the role "project manager" can view the project statistics.
For functions that are disabled in the
settings
(for example the selection of projects)
no statistics are available accordingly.
Summary
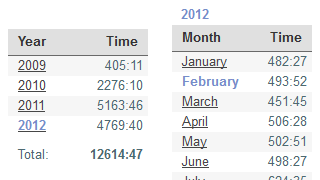 Under the sub-menu 'Summary' a brief statistically summary is displayed - such as
the total working hours for the entire timekeeping or for a project or a user.
The selection for the period looks the same for all sub-stats:
A list of all years and months is shown for which there is useful data for your timekeeping.
When a year is selected, a tabular listing and a graphical analysis in the form of a
line chart is shown. Accordingly with the selection of a month a chart
of the monthly variation of the values will be displayed.
Currently selected annual and monthly periods are highlighted in color.
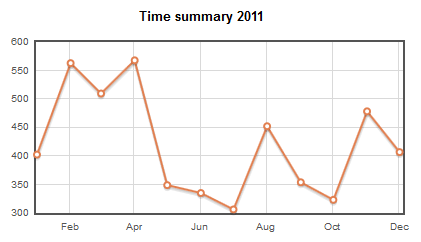 A chart of the total hours of work of the timekeeping over the period of a selected year.
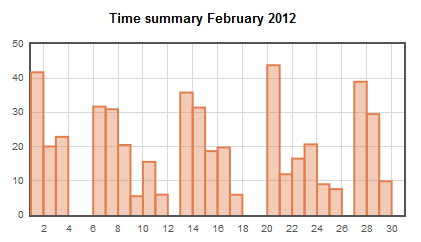 When selecting a month, the value of each day of the selected month
are presented graphically as a bar chart.
Statistics summary for a whole slew of data can be evaluated both as table and chart. An example of the summary of customer data is shown below:
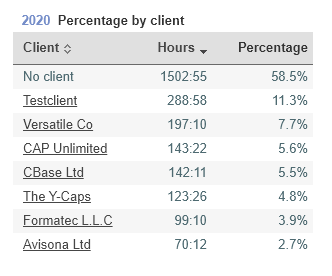 The tabular analysis of monthly statistics for a client:
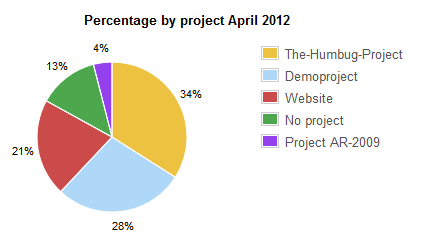
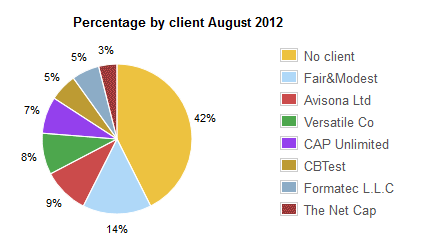 The same customer data for the selected month as a pie chart.
Project statistics
 The 'Project statistics' is (like all other statistics sections too) constructed on the
same pattern as the 'Summary': A period is selected by an annual and monthly list.
In addition, a project for which the statistics are displayed is selected from a drop down list.
Optionally the date can be filtered for a employee, so that only the portion of the employee
of the total project is taken into account.
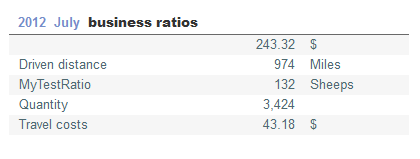 Business ratios are also displayed in the project statistics
if they are enabled in the
settings
and if business ratios have been registered for the specified period and
the selected project. In all other views of the statistics
(eg, the user or the summary statistics) the related business ratios totals are listed too.
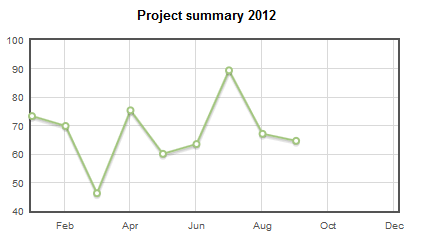 For projects, various summary statistics can be queried too.
Client statistics
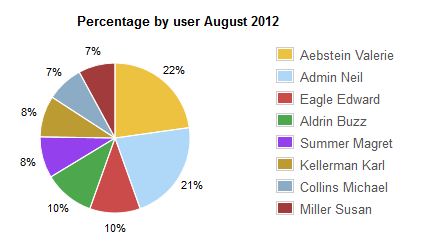 In the 'Client statistics' all relevant statistical data for a customer are evaluated.
Annual or monthly effort for a customer is displayed. For example, the portion of a user or
the portion of a project for a particular customer is shown.
User statistics
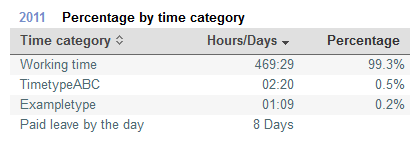 The 'User statistics' displays statistical data for the selected user
such as the percentages for time types, projects or clients.
The data are displayed as tables and also as charts.
